

Zabbix 7.0: Web monitoring, performance boost, better graphics
Zabbix has introduced version 7.0 of its monitoring tool. It is faster, offers more displays for metrics and monitors websites better.
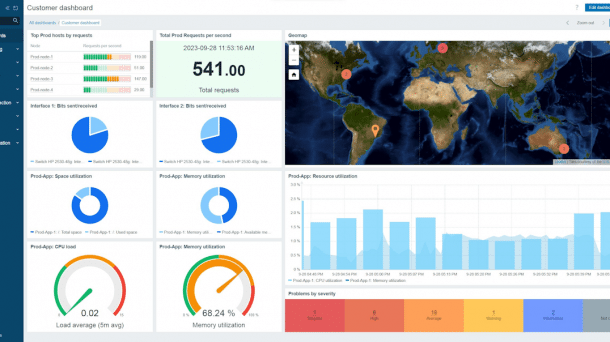
(Image: Zabbix)
- Martin Gerhard Loschwitz
Zabbix has introduced the next major release of its open source monitoring system of the same name: Zabbix 7.0 is now available for download. The developers have tinkered with every possible nook and cranny of the solution and made improvements both large and small. The release comes almost two and a half years after Zabbix version 6.0.
One key innovation concerns the monitoring of websites: This has always been regarded as a kind of supreme discipline in monitoring, because simply monitoring the HTTP status response of a monitoring server is not enough here. This is because it may well have the return value 200, even if the web server has only delivered an empty page. Instead, meaningful website monitoring must recreate the navigation of a user through the page in order to detect possible malfunctions in detail. Zabbix 7.0 offers precisely this possibility via predefined templates.
Numerous improvements have also been made to the Zabbix proxy. This is the name of a service in Zabbix that collects monitoring data instead of the server in a local setup and then makes it available to the actual Zabbix server. Until now, the assignment of a Zabbix proxy to the target machines to be queried was static. Zabbix 7.0 offers both the possibility of dynamic control and the option of operating pairs of Zabbix proxy instances as a high-availability setup. In this way, the admin can specify that particularly critical parts of his infrastructure are monitored by another running instance of the Zabbix proxy if the Zabbix instance that is actually responsible for them goes down at short notice. On top of this, its developers have also tweaked the performance of the proxy and now promise more performance with significantly less load on the host system.
Asynchronous data collection
In times of massively scalable setups, the collection of metrics data is practically as important as the collection of monitoring data. In many places today, "trending" is on the same level of relevance as monitoring and alerting. Zabbix has mastered the collection of metrics data and its visual presentation for some time now. However, the internal Zabbix processes that were previously used to collect metrics data only worked synchronously. This meant that a query to a host had to be completed before a query to another host or another query to the same host could take place. In the past, however, this led to performance problems, especially in large setups with many metrics to be monitored.
In Zabbix 7.0, the data collectors therefore function asynchronously. This means that several queries can be started at the same time and the collection process processes the incoming responses one after the other. This makes it possible to carry out up to 1000 queries per collection process simultaneously, where previously only a single query was possible. Here too, Zabbix administrators can look forward to much better performance.
In line with this, there is a central innovation in the timeout configuration of all processes in Zabbix that collect data from target systems. Anyone who queries another host during monitoring usually wants to define a time limit that applies to the query. If this takes longer than the limit, a timeout error message must be sent to the monitoring. And if necessary, this sets an event chain in motion. Until Zabbix 7, however, these timeouts had to be defined manually for each collection tool, which meant an enormous amount of extra work. The timeouts can still be defined manually in Zabbix 7.0. However, there is now a central menu for this in the configuration of the Zabbix server. What looks like an inconspicuous change from the outside should make everyday life much easier for many Zabbix admins.
Everything is so colorful here
The Zabbix developers have also significantly improved the graphical display of collected metrics data. For the first time, Zabbix supports the "Gauge" graphic type, a speedometer-like display that shows values such as temperatures or speeds on a scale. The administrator has virtually no limits when defining the gauges. Warning areas can also be defined - for example, it is possible to graphically display the fill status of data drives in a way that gives the administrator an immediate overview of the situation. Another new feature in Zabbix 7.0 is the display with "honeycombs". Here, specific values can be displayed in a honeycomb pattern, correlated in this way and also colored in such a way that critical values of individual checks immediately catch the eye.
Another new feature in Zabbix 7.0 is native support for two-factor authentication, although this comes rather late. But better late than never is the motto. Especially as Zabbix, which is much better protected in this way, also has other qualities. The detection of external resources integrated into Zabbix, such as network devices, has also been significantly updated in Zabbix 7.0 and now supports the LLD protocol much better than before.
Videos by heise
In addition, there is a central, non-technical innovation: from version 7.0, Zabbix is no longer subject to the conditions of GPL 2, but to those of AGPL 3.0. While more and more manufacturers are being misled by the "open core" principle, Zabbix is taking the opposite approach and placing Zabbix under a license that is even more open than the GPL. Zabbix CEO Alexei Vladishev explained the reasons behind this in detail in a blog post at the beginning of April. However, nothing will change directly for admins as a result of the change and they can continue to use Zabbix as before.
The updated Zabbix is available for download in various forms on the manufacturer's website.


(emw)
